Butterworth bandpass filtering between 0.5 and 40 Hz
Applied AI + eHealth · 04 FEB 2025
BitaHealth
A reproducible physiological-signal pipeline that moves from raw ECG recordings to cleaned signals, R-peak detection, time- and frequency-domain HRV metrics, and interpretable visualizations.
Python / NeuroKit2 / ECG / HRV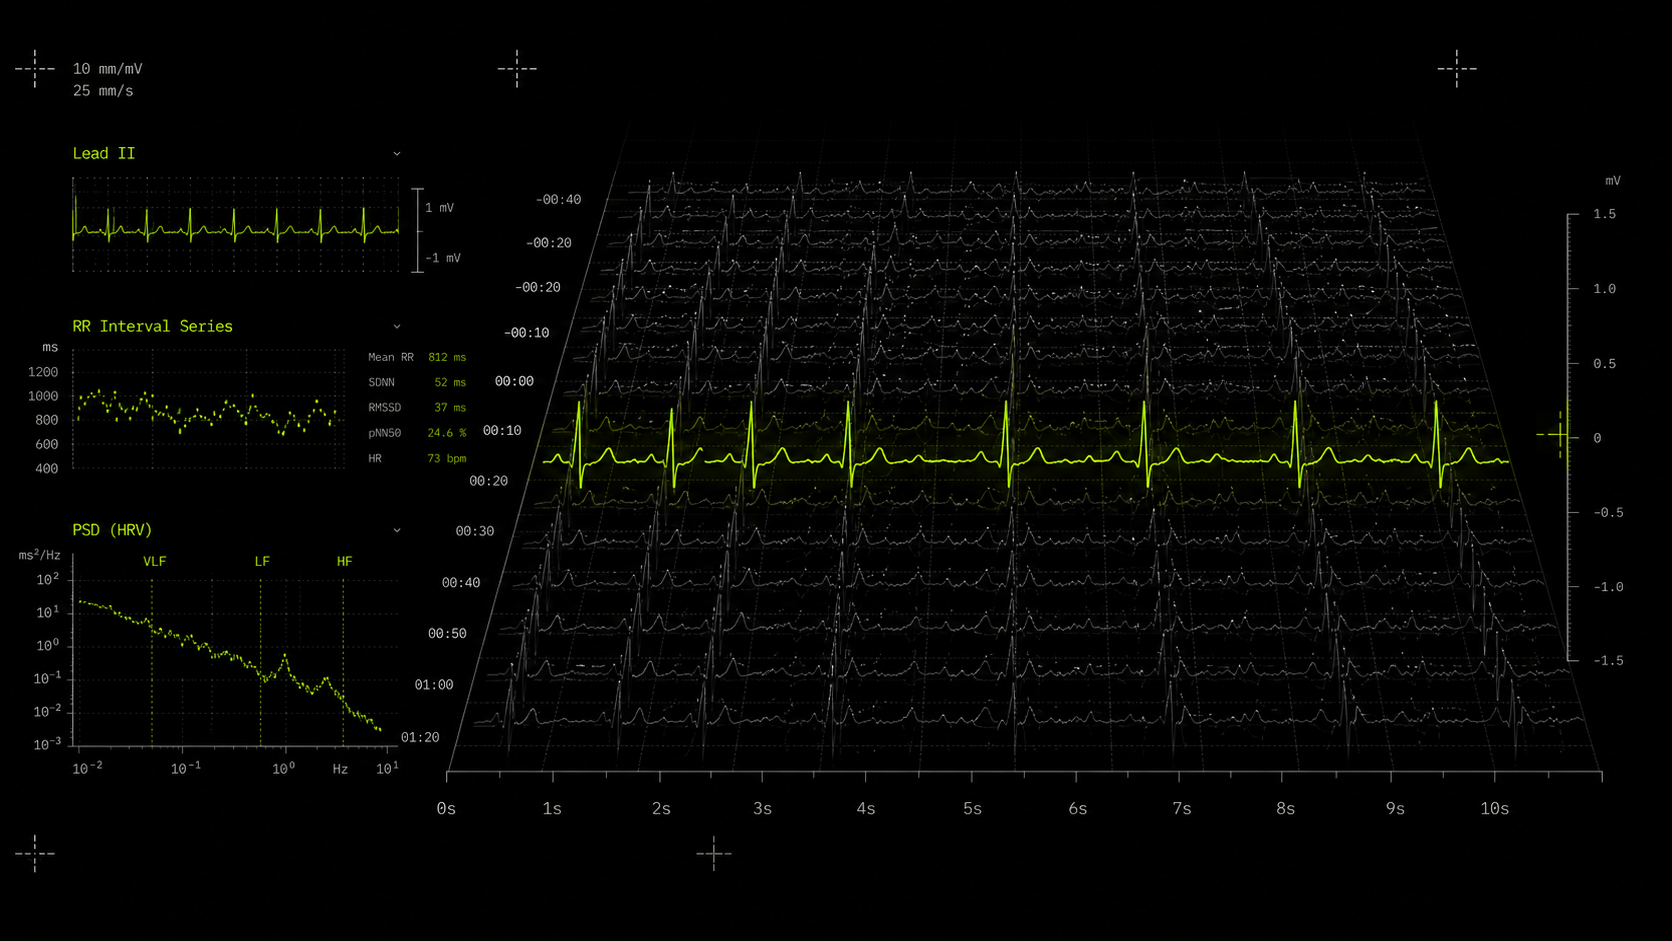 PROJECT VISUAL / VERIFIED
TL;DR / KEY SIGNALS
R-peak processing and artifact correction with NeuroKit2
SDNN, RMSSD, and LF/HF analysis with diagnostic plots
Pipeline overview
BitaHealth structures HRV analysis as a clear sequence that can be reproduced or adapted to other physiological datasets.
- Load raw ECG signals from exported data.
- Remove baseline drift and noise with bandpass filtering.
- Detect R-peaks and correct artifacts.
- Compute time-domain and frequency-domain HRV features.
- Visualize the filtered signal, spectral density, and metric summaries.
Signal processing
A fifth-order Butterworth bandpass filter between 0.5 and 40 Hz removes baseline wander and high-frequency noise while preserving the morphology needed for peak detection.
NeuroKit2 processes the filtered ECG at a 500 Hz sampling rate, extracts R-peaks, and provides the inputs required for HRV computation.
Interpreting HRV
Time-domain measurements such as SDNN and RMSSD describe overall variability and short-term changes. Frequency-domain analysis, including the LF/HF ratio, provides a view of the balance between sympathetic and parasympathetic activity.
Matplotlib outputs combine the filtered ECG, detected peaks, HRV series, power spectral density, and summary data into a reviewable analysis workflow.
FULL DOCUMENTATION
Open detailed PDFGo deeper into the complete project.
Open the original associated PDF for the full methodology, code, analysis, and project evidence.